UFO Sightings Interactive Data Visualization
An interactive map and dashboard built with React and D3.js to explore UFO sighting patterns across the United States.
Scope
NJIT IS219 Academic Project
Timeline
Mar–May 2025
Category
Data Visualization
Problem / Assignment
Create interactive visualizations with React using real-world datasets while following front-end best practices.
Challenges
- Messy geospatial data
- Rendering thousands of points efficiently
- Designing intuitive controls for non-technical users
Objectives
- Integrate React + D3.js
- Use Docker for reproducible dev
- Publish to GitHub Pages
Research & Visual Samples
Development
Architecture & Structure
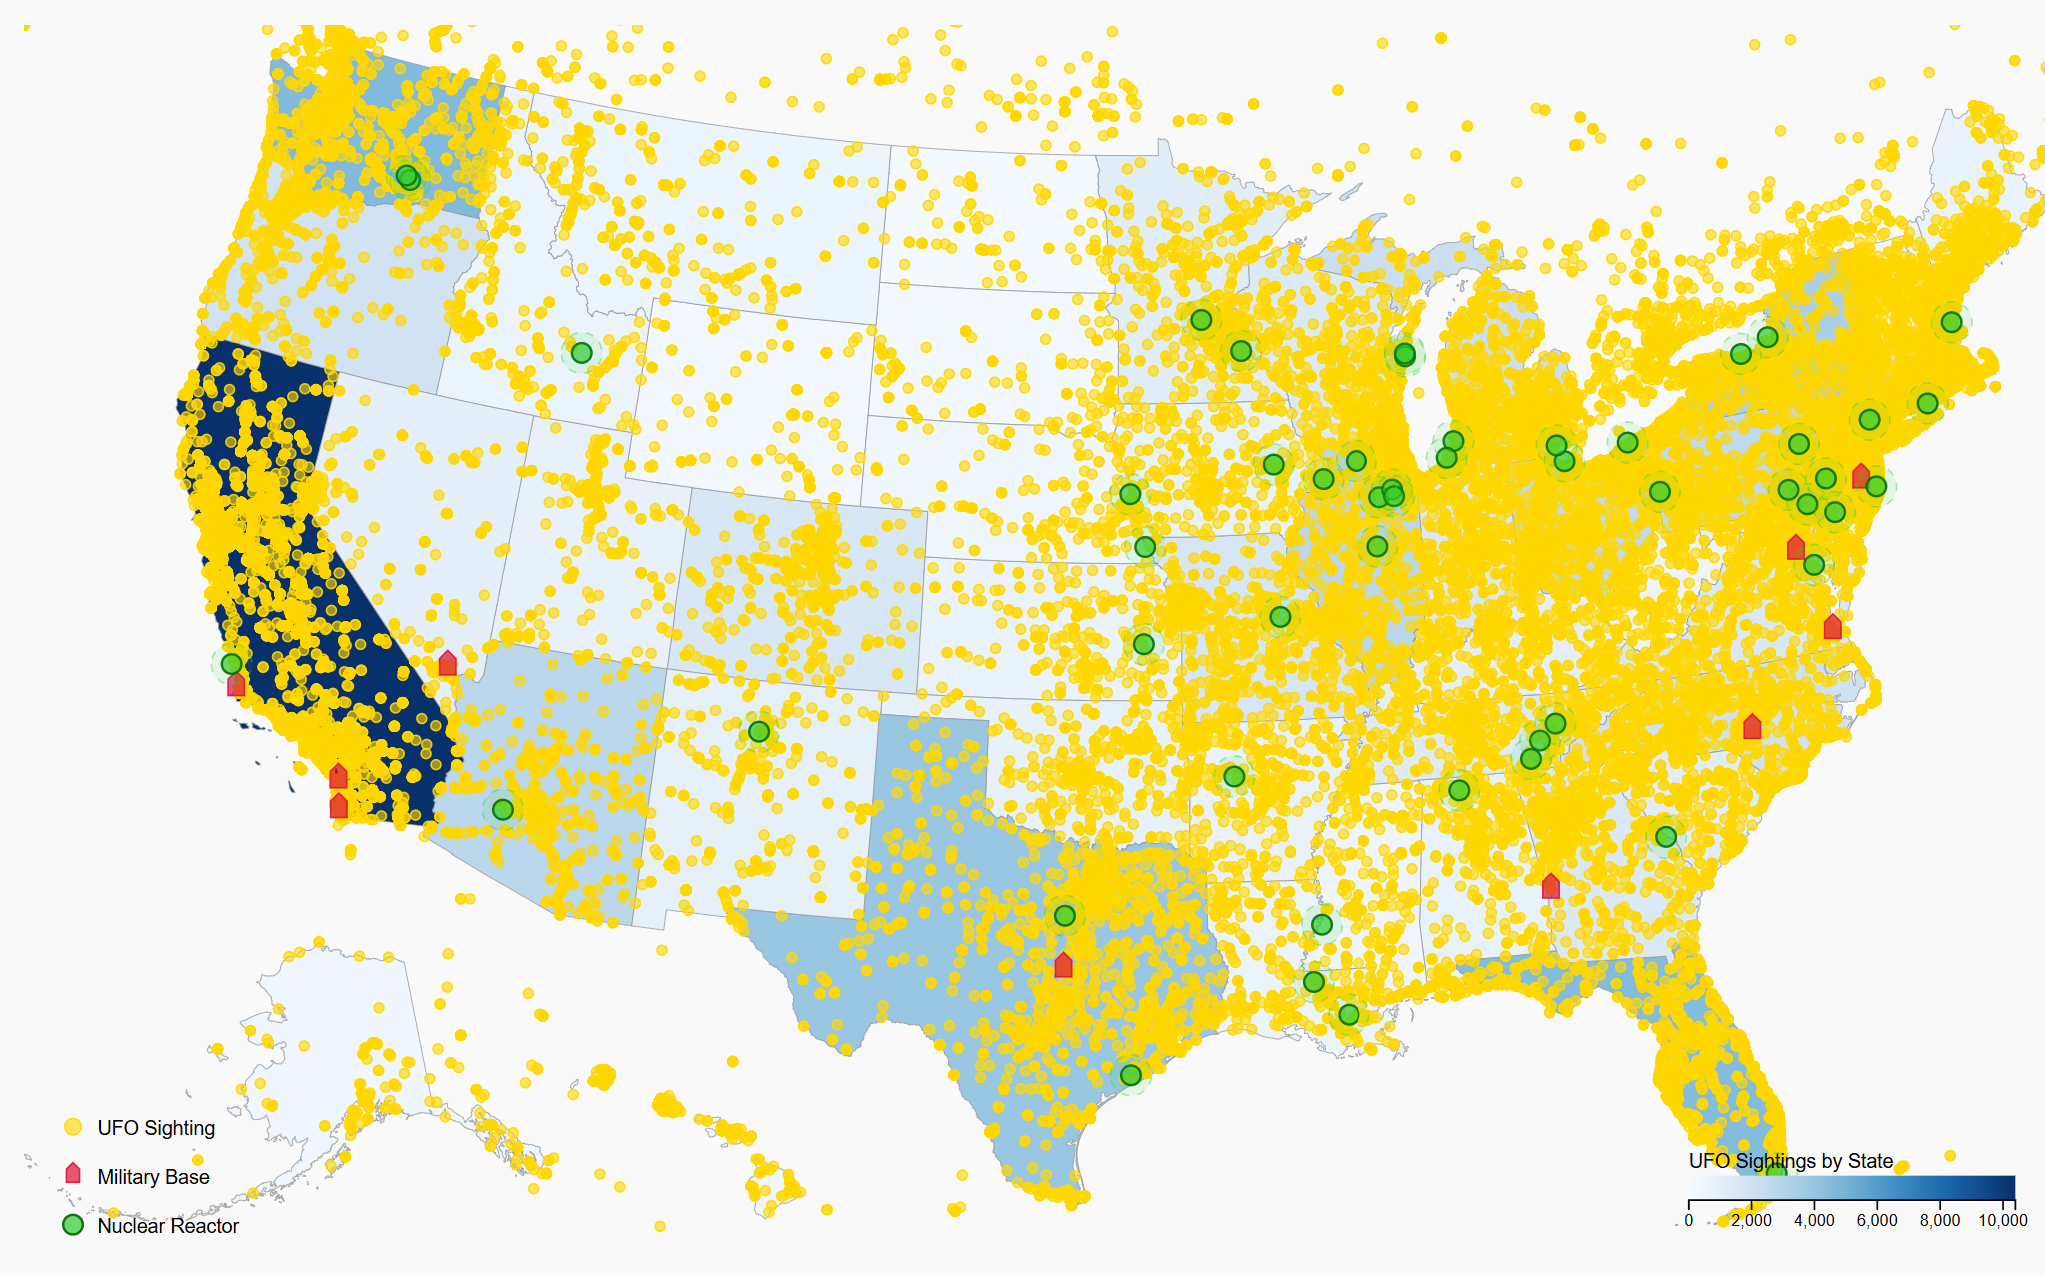
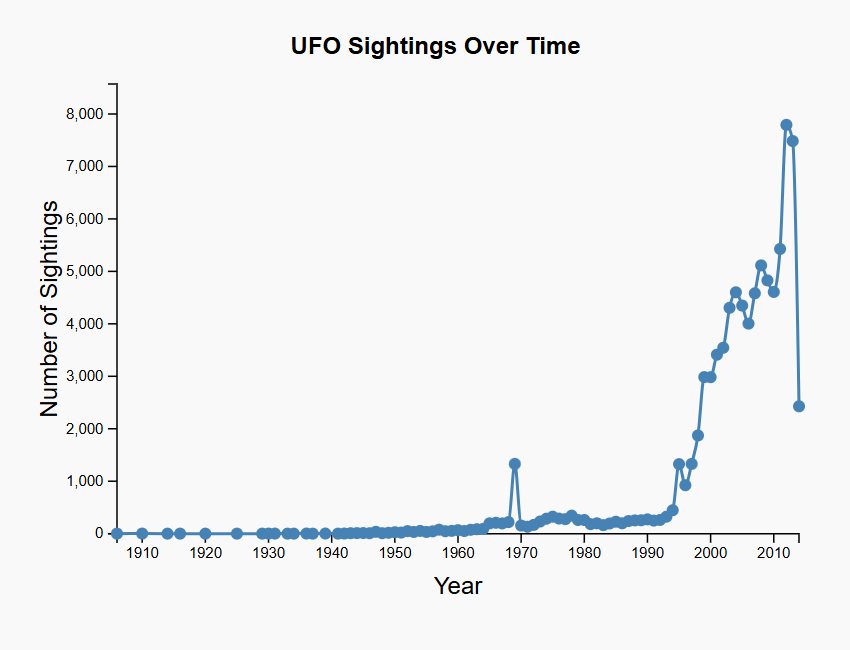
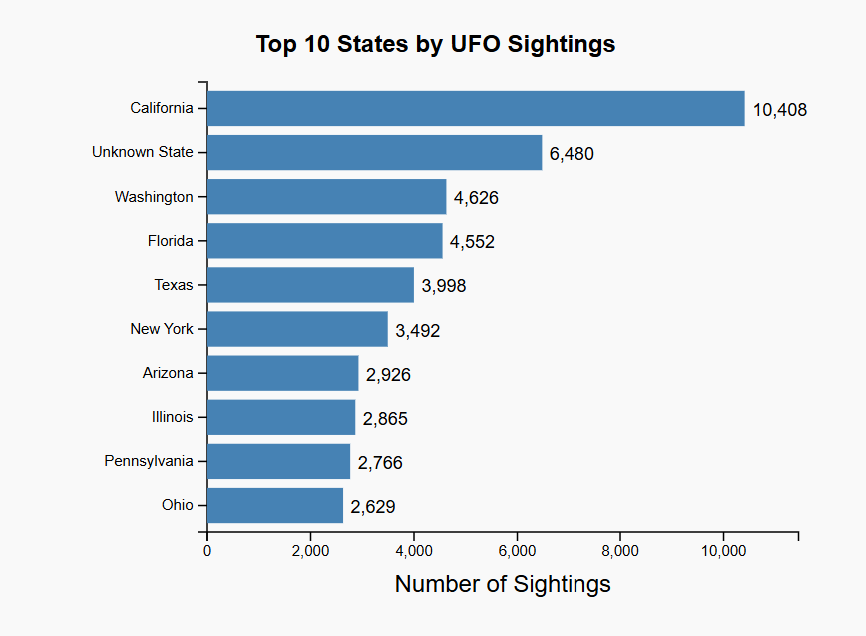
Modular visualization components (Map, Timeline, Rankings), data processing utilities for CSV parsing and normalization, and shared state for filters and interactions.
Key Technical Decisions
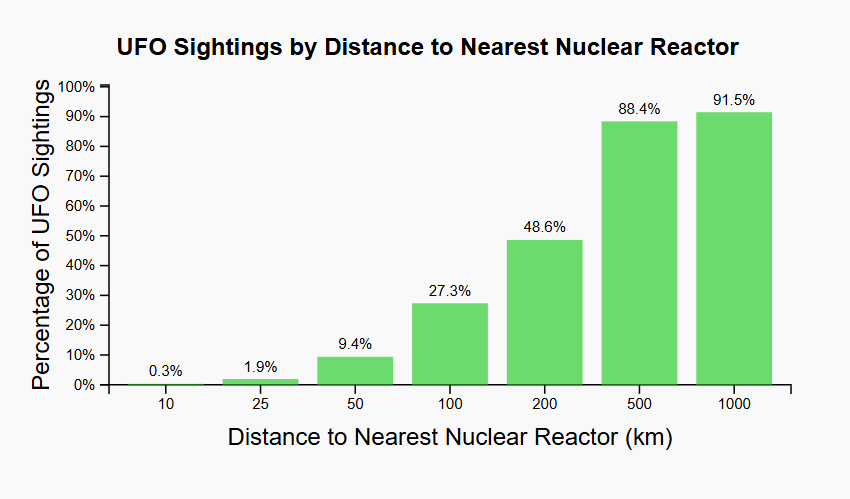
Used D3 geographical projections, color scales for density, and dynamic overlays for military bases and nuclear facilities to provide analytical context.
Testing & Iteration
Iterated on performance and UX: improved rendering performance, refined controls, and validated mapping accuracy against reference datasets.
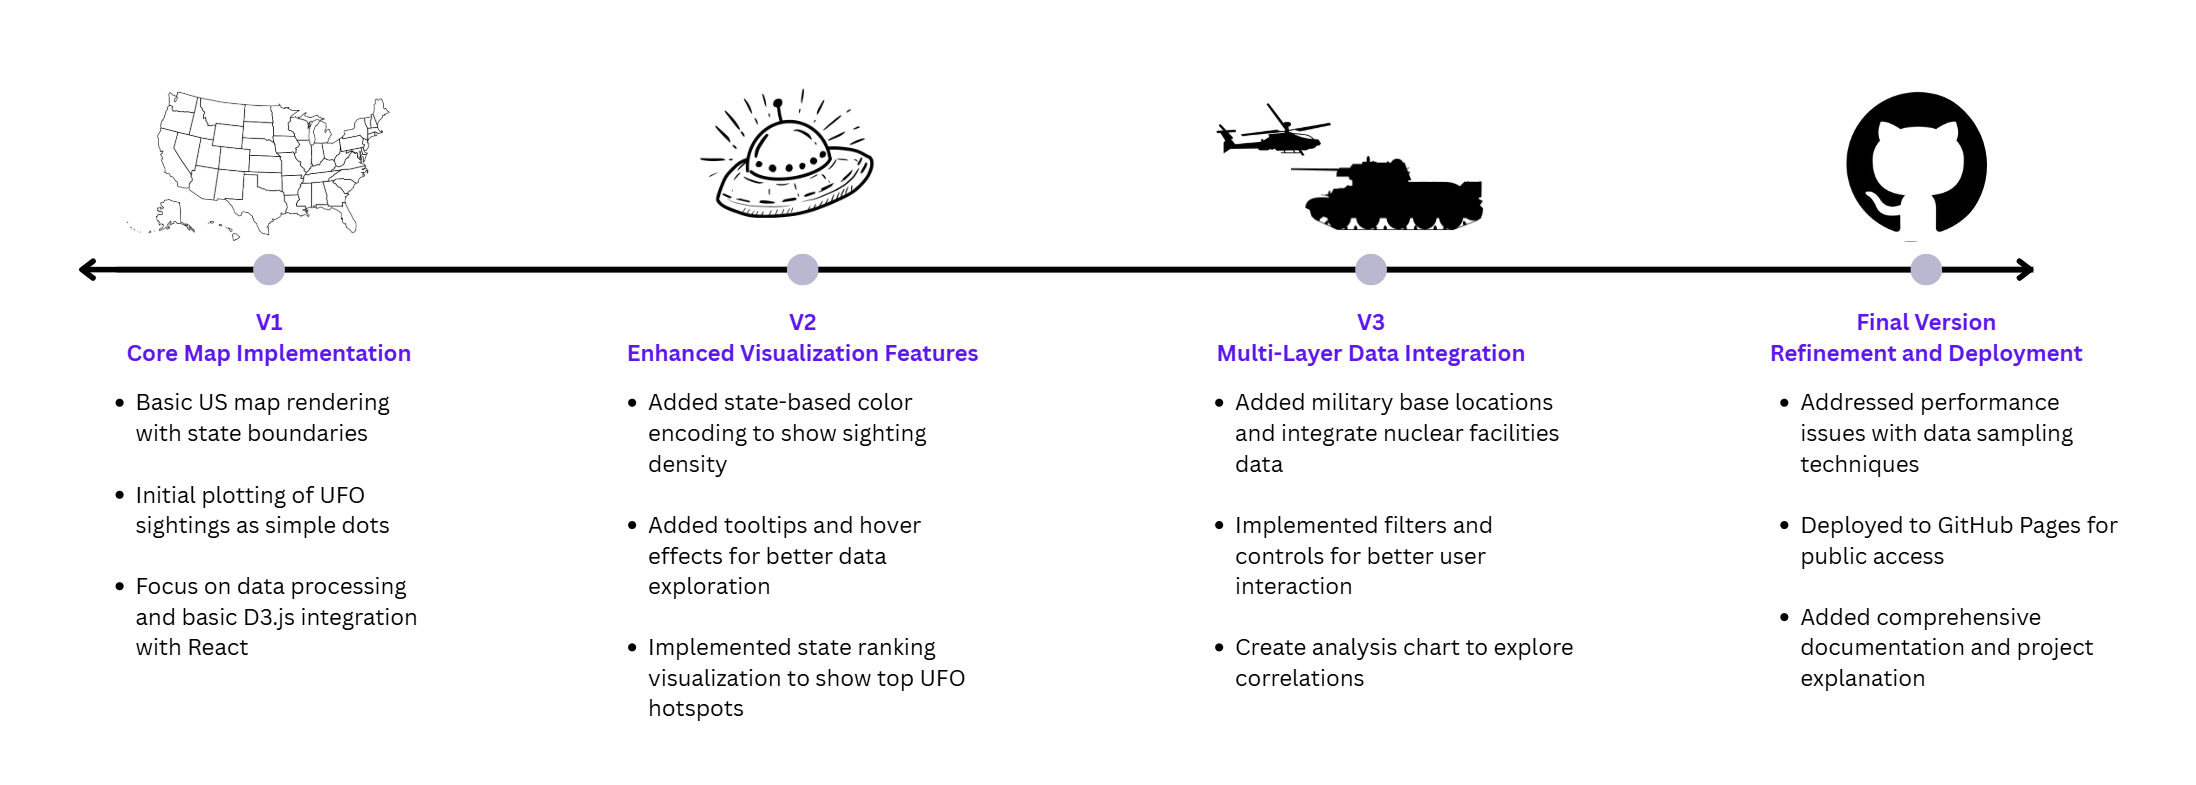
Project Timeline
Conclusion
The project transforms raw sighting data into an interactive exploration tool, enabling discovery of temporal and geographic patterns while demonstrating React+D3 strengths.
Future Enhancements
- Advanced filtering options
- More interactive visual overlays
- Mobile optimization
- Real-time data integration